Thornthwaite climate classification 1931 AND 1948
Thornthwaite
climate classification
Thornthwaite climate classification A system for describing
climates devised in 1931 and revised in 1948 by the American climatologist Charles Warren Thornthwaite (1889–1963) which divides
climates into groups according to the vegetation characteristic of them, the
vegetation being determined by precipitation
effectiveness (P/E, where P is the total monthly precipitation and E is
the total monthly evaporation). The sum of the monthly P/E values gives the P/E
index, which is used to define five humidity provinces, with associated
vegetation. P/E index of more than 127 (wet)
indicates rain forest; 64–127 (humid) indicates forest; 32– 63 (subhumid)
indicates grassland; 16–31 (semi-arid) indicates steppe; less than 16 (arid)
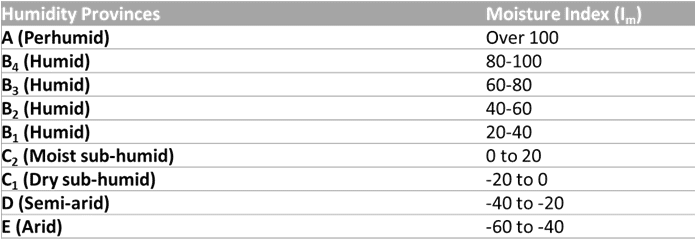
indicates desert. In 1948 the system was modified to incorporate a moisture index, which relates the water demand by
plants to the available precipitation, by means of an index of potential evapotranspiration (PE), calculated from
measurements of air temperature and day length. In arid regions the moisture index is negative because precipitation is
less than the PE. The system also uses an index of thermal efficiency, with
accumulated monthly temperatures ranging from 0, giving a frost climate, to
more than 127, giving a tropical climate.
Thornthwaite’s classification is, thus, based on two important
indices:
1. Precipitation Effectiveness (PE). Effectiveness of
precipitation depends on the distribution pattern of rainfall in a calendar
year and evaporation of moisture back to the atmosphere through different
surfaces and means. Seasonal deficiency and surplus of rainfall affects plant
growth significantly.
2.
Temperature Efficiency (TE). Temperature efficiency relates to variation in temperature and
its role in the growth of plants. Equatorial areas where sunlight and
temperatures are usually high with insignificant variation in a calendar year,
growth of plants remains high. Contrary to it, arid areas reflect high
variation in temperature and sun-light, hence plant growth is retarded
significantly. Potential evaporation is, thus, an index of temperature
efficiency.
Thornthwaite climate classification An expressed for precipitation efficiece was obtained by relating
measurement of pan evaporation to temperature and precipitation. For each month
the ratio 11.5 (rt-10)1019 where r = mean monthly rainfall (in inches) t= mean
monthly temperature Main climatic group based an precipitation effectiveness
|
Humidity
province |
Vegetation |
P/E
index |
|
A (Wet) |
Rainforest |
127 |
|
B(Humid) |
Forest |
64-127 |
|
C(Sub- humid) |
Grassland |
32-63 |
|
D(Semi-arid) |
Steppe |
16-31 |
|
E(Arid) |
Desert |
>15 |
Main climatic group based an Thermal efficiency Thornthwaite
introduced can index of thermal efficience which
is expressed by the positive departure of monthly mean temperature from
freezing point. The inex is thus the annual sum (t-32) for each month
temperature ratios (T/E).
|
Temperature |
T/E index |
|
A:
Tropical |
127 |
|
B:Mesothermal |
64-127 |
|
C:
Microthermal |
32-63 |
|
D:
Taiga |
16-31 |
|
E:Tundra |
1-15 |
|
F:Frost |
0 |
T/E index-sum of 12 monthly values of (T-32)/4.Where
T mean monthly temperature. On the basis of the monthly seasonal distribution
of precipitation the humidity province were subdivided into the following.
r:rainfall adequate in all season s: rainfall and different in summer w;
rainfall deficient in winter d: rainfall deficient in all season.
It differs from Koppen classification in that
I. Koppen
employed simple temperature and and precipitation values as limiting
boundaries, whereas Thornthwaite introduced new concepts, temperature
efficiency and precipitation effectiveness. This new concept cannot be
expressed in ordinary climatic values. Consequently the boundaries are not
easily comprehended.
II. The number of different climatic types appearing
on the world map of Thornthwaite reaches a total of 32, approximately three
times the number of Koppen types.
III. In Thornthwaite classification, the number of
symbolic letters is few and their combinations are simple and easy to remember.
IV. The climatic types have no descriptive names, so
that they can be designated only by their letter formulas.
Weakness:
I. Like Koppen’s classification, this classification
seems to be inefficient in comparing climate of two different locations.
Precicipation effectiveness cannot be precisely ascertained due to lack of
proper data of monthly temperature and precipitation.
II. Climatic
classifications as devised by both Koppen and Thornthwaite are more powerful to
zoologists, botanists and geographers but fail to serve the purpose of
meteorologists and climatologists because the interplay between the weather
elements and other climatic factors is not clearly depicted
1948 Classification:
After making sizeable modifications Thornthwaite presented his
modified scheme of climatic classification in 1948. Though he again used
previously devised three indices of precipitation
effectiveness, thermal efficiency and seasonal distribution of precipitation in
his second classification but in different way. Instead of vegetation,
as done in 1931 classification, he based his new scheme of climatic
classification on the concept of potential
evapotranspiration (PE) which is in fact an index of thermal efficiency and
water loss because it represents the amount of transfer of both moisture and
heat to the atmosphere from soils and vegetation (evaporation of liquid or
solid water, and transpiration from living plant leaves) and thus is a function
of energy received from the sun.
(i) Moisture index (Im),
(ii) Potential evapotranspiration or thermal efficiency index
(PE),
(iii) Aridity and
humidity indices, and
(iv) Index of concentration of thermal efficiency or potential
evapotranspiration.
if: Precipitation > PET = Soil Moisture +ve
Moist Climate determined by Aridity Index (variability in summer and winter)
Dry climate determined by Moisture Index


0 Comments